Vegetation Sampling
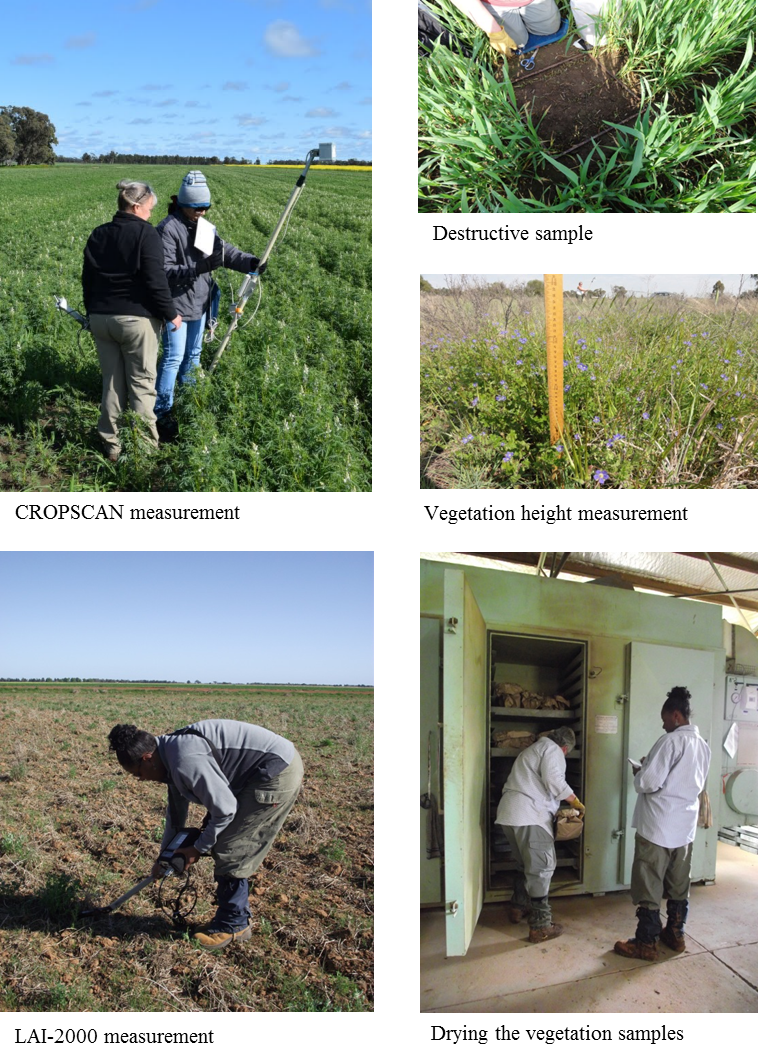
Vegetation water content (g of water per m2) is an important parameter for modelling land surface emission and backscatter at L-band. Therefore, destructive vegetation samples were collected at various locations in the study area, with the aim to characterize all the vegetation types present. Surface spectral reflectance and leaf area data are valuable in developing methods to estimate the vegetation water content and other canopy variables over large areas. Spectral observations were made concurrent with biomass sampling in order to provide the essential information needed for larger scale mapping using aircraft and satellite observations. During SMAPEx-5, a Multi Spectral Radiometer (MSR) developed by CROPSCAN was used. Note that the MSR bands used coincide with the MODIS instrument. Leaf area was measured using a LAI-2000.
The vegetation sampling strategy was based on the assumption that the changes in vegetation (biomass, VWC and plant structure) are negligible within a week, and therefore the same paddock was sampled with one week revisit time. Vegetation samples for biomass, vegetation water content, soil surface reflectance and LAI measurements were collected daily at the 2.8km × 3.1km focus areas. Vegetation sampling largely followed the sampling schedule of the soil moisture monitoring. However, since cropping areas (YA4, YA7 and YF) are expected to present a large variety of vegetation types and growth stages to be sampled, as opposed to the more uniform dry land areas (YB5, YB7 and YE), the former will be strictly sampled when coincident aircraft spectral observation of the area are scheduled.Vegetation sampling was repeated at the SAME locations as the week before, to accurately track temporal changes in vegetation biomass. Within each focus area, all major vegetation types were monitored. In the eventuality that different growth stages of the same vegetation type existed within the sampling area, they were independently sampled. Each major vegetation type (or growth stage of the same vegetation type) was characterised by making measurements at a minimum of 5 sampling locations distributed within “homogeneous” crops/paddocks. Additional vegetation sampling was performed outside the focus areas when a major vegetation type observed within the SMAPEx-5 study area was not represented in these. All vegetation measurements were prioritised between approximately 10am and 2pm eastern standard time to optimise the ground spectral observations. To assist with interpolation of vegetation water content information and derivation of a land cover map of the region, the vegetation type and vegetation canopy height were recorded for each vegetation type sampled. In the case of crops, additional information on row spacing, plant spacing and row direction (azimuth angle) were recorded.
Vegetation sampling was concentrated in the 3km x 3km focus areas. Within each area, the major vegetation types and phonological stages were characterised by making measurements at 5 locations distributed within homogeneous crops/paddocks. At each location, measurements consisted of 1 destructive sample, 54 LAI and 25 CROPSCAN readings. LAI and CROPSCAN were then averaged, after quality control, into a single LAI and CROPSCAN reading per location. Additional observations at each location included plant height as well as crop row spacing and direction and plant spacing in crops. Complete details on the vegetation sampling strategy and protocols can be found in the SMAPEx-5 workplan.
The vegetation sampling was performed by a dedicated team. This vegetation sampling team was in charge of collecting:
· Vegetation and litter destructive samples;
· Vegetation canopy reflectance measurements;
· Vegetation canopy LAI measurements;
· Information about vegetation type, canopy height, crop row spacing and direction, and
· GPS location of the actual vegetation sampling site.
The vegetation team was equipped with a GETAC unit in order to navigate through the focus areas using GPS positioning like for the sampling teams. The GETAC contained information on main roads, properties and lot boundaries and irrigation canal to aid the navigation and selection of the sampling locations.Users can download all data via the Download Centre.
Vegetation sampling schedule
Focus area
Vegetation type
Date sampled
Nr.
measurementsYA4 Winter wheat 10/09 5 YA4 Pasture 12/09 5 YA4 Lucerne 12/09 2 YA4 Winter wheat 12/09 3 YA4 Bare soil 12/09 1 YA4 Winter wheat 18/09 4 YA4 Winter wheat 22/09 3 YA4 Barley 22/09 1 YA4 Lucerne 22/09 2 YA4 Winter wheat 25/09 3 YA4 Burned rice 25/09 1 YA4 Winter wheat 27/09 4 YA4 Bare soil 27/09 1 YA4 Barley 27/09 1 YA7 Lupins 09/09 4 YA7 Canola 09/09 4 YA7 Winter wheat 10/09 5 YA7 Bare soil 10/09 1 YA7 Bare soil 14/09 1 YA7 Winter wheat 14/09 4 YA7 Lupins 17/09 4 YA7 Canola 17/09 3 YA7 Winter wheat 17/09 5 YA7 Lupins 24/09 2 YA7 Canola 24/09 2 YA7 Winter wheat 24/09 4 YF Winter wheat 11/09 2 YF Pasture 11/09 5 YF Rice straw 11/09 2 YF Pasture 19/09 6 YF Winter wheat 19/09 3 YF Barley 19/09 1 YF Small grain 19/09 2 YF Winter wheat 26/09 3 YF Rice straw 26/09 1 YF Pasture 26/09 3 YF Small grain 26/09 2 YE Winter wheat 15/09 2 YE Oats 15/09 1 YE Barley 15/09 2 YE Barley stubble 15/09 1 YE Pasture 18/09 4 YE Barley 22/09 2 YE Oats 22/09 1 YE Winter wheat 22/09 2 YE Oats 27/09 1 YE Winter wheat 27/09 2 YB5 Grazed pasture 16/09 5 YB7 Grazed pasture 16/09 4